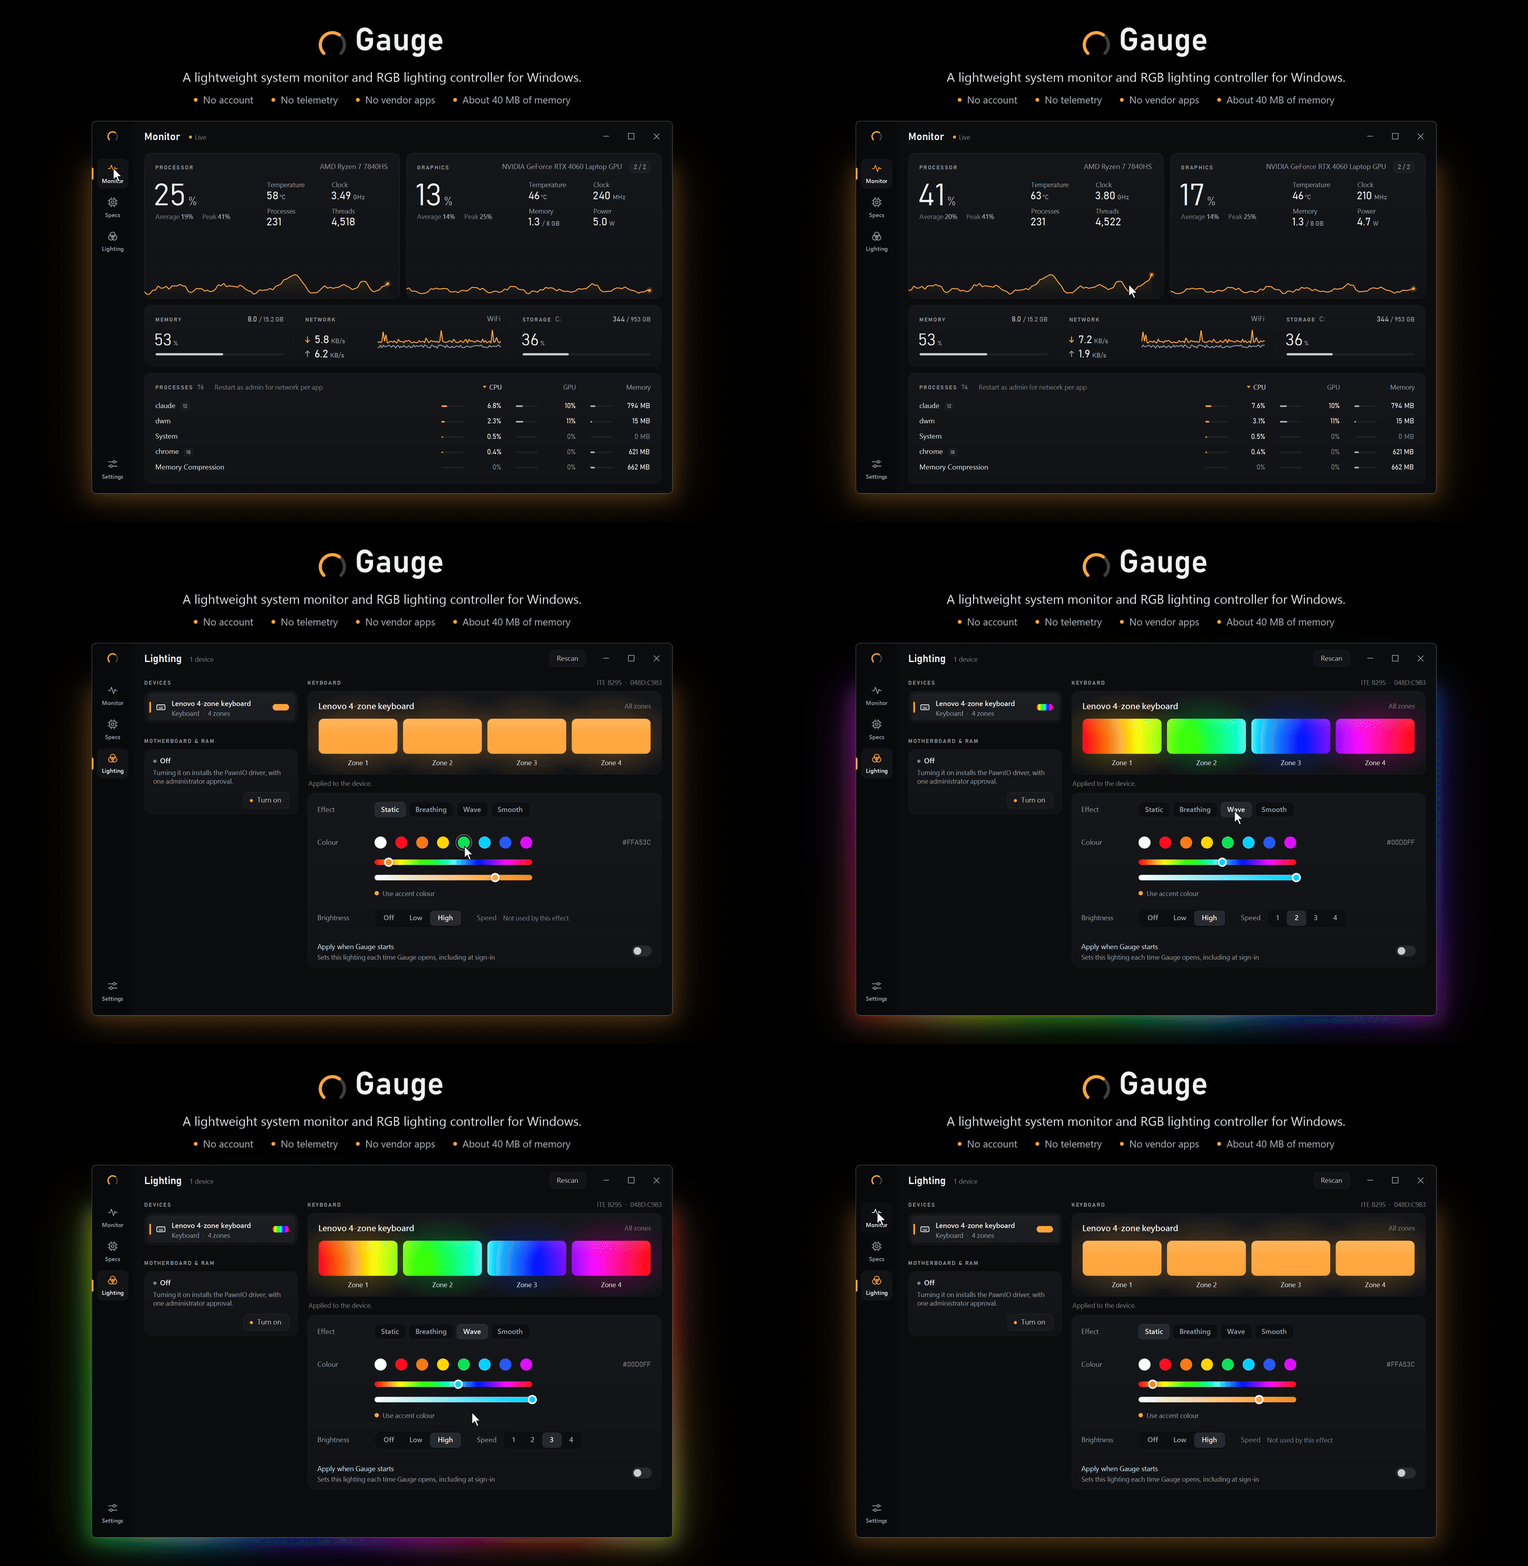
Live readings, ninety seconds deep.
CPU and GPU load drawn edge to edge, with temperature, clock, power and fans beside them. Memory, network, storage and every running app, on one page.
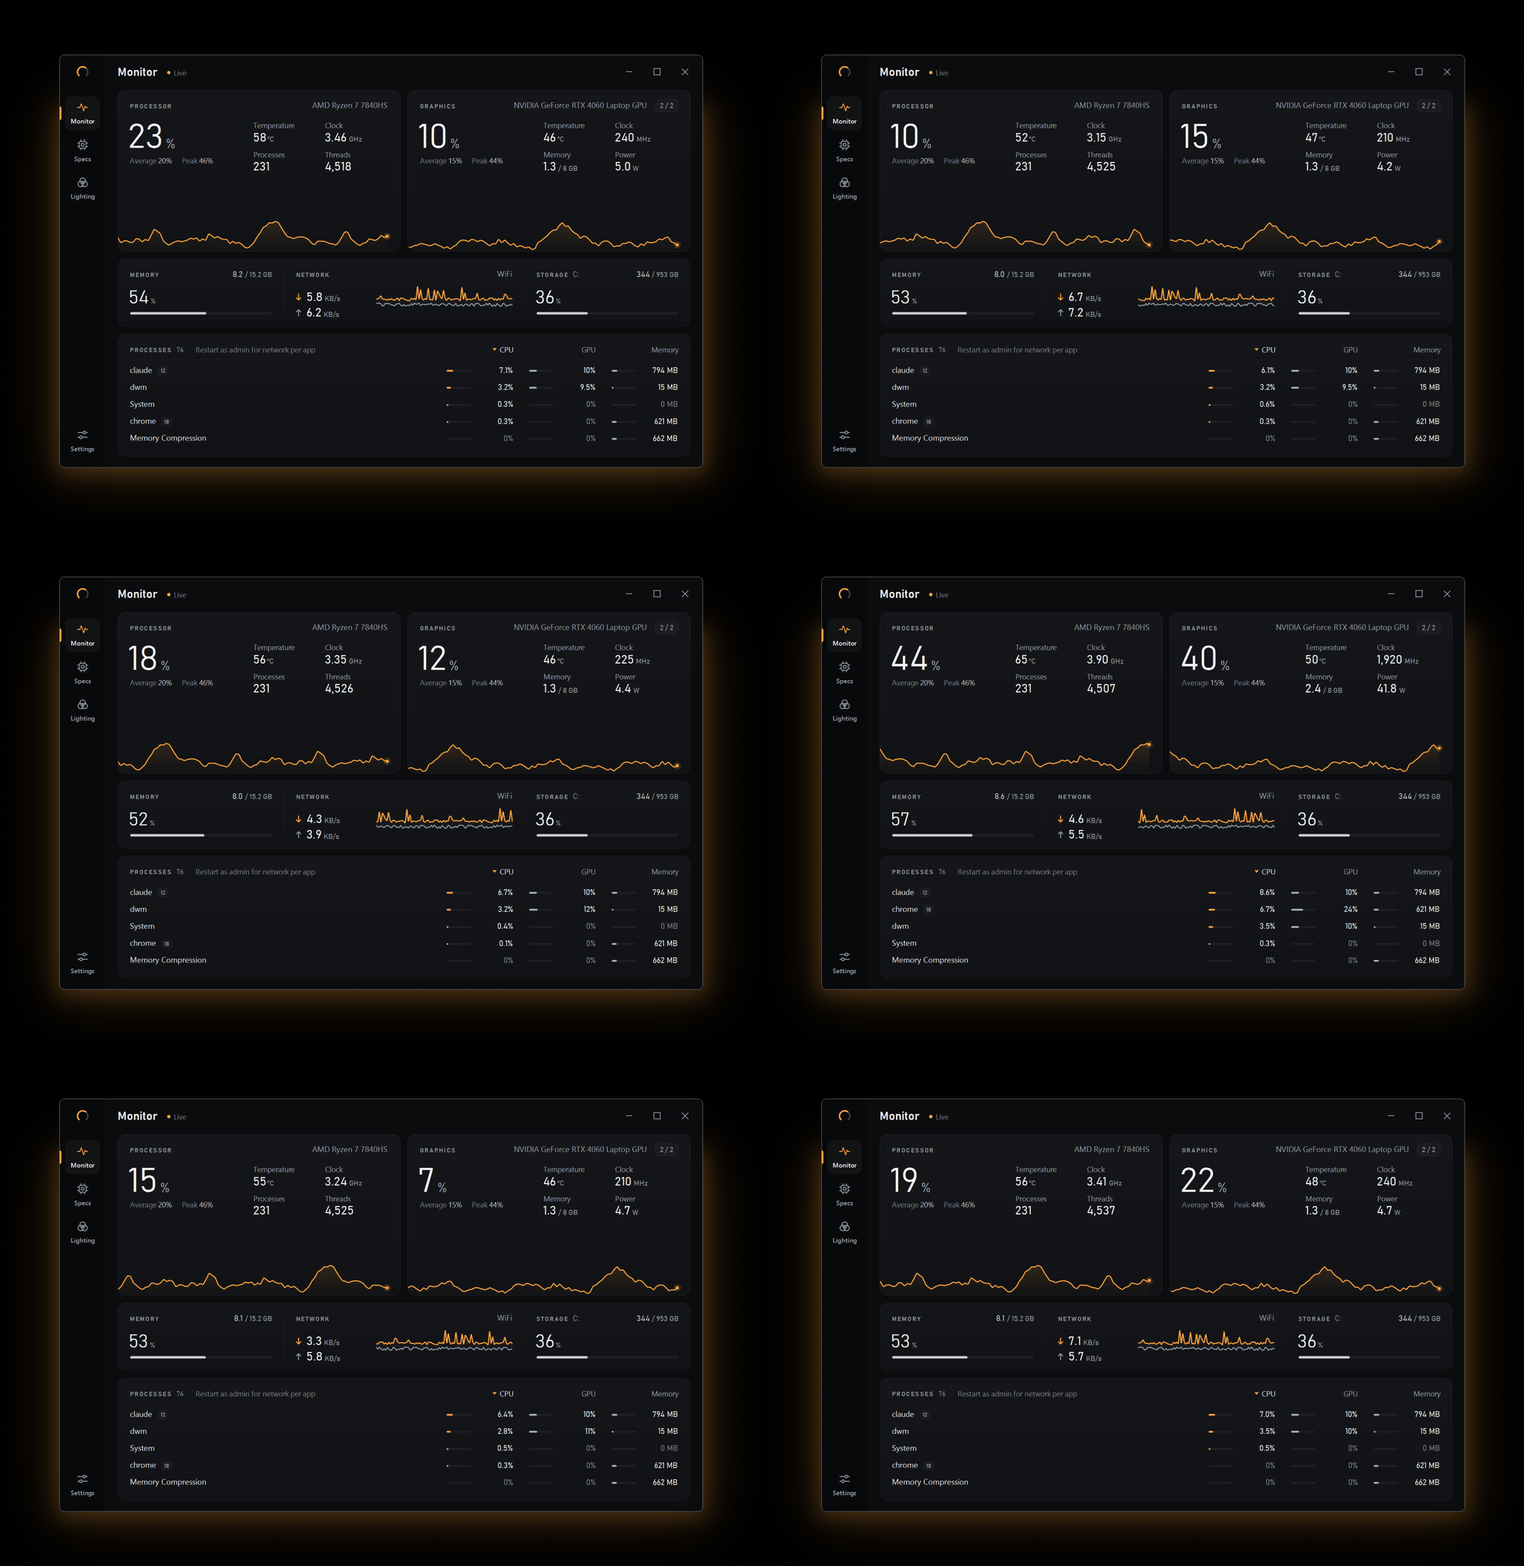
- CPU and GPU, in fullLoad with 90 seconds of history, plus temperature, clock, power, fan and video memory where the hardware reports them.
- Heat you can see Temperatures turn amber, then red, as they climb.
- Memory, network, storageAt a glance, with download and upload charted live.
- Apps, not just processesGrouped by app and sortable by CPU, GPU or memory. Run as administrator for per-app download and upload speeds.
- More than one GPUSwitch between graphics cards on machines that have several.
- Always lightweightAll of it in about 40 MB, so the monitor never becomes the thing you're monitoring.